VENHA CONHECER
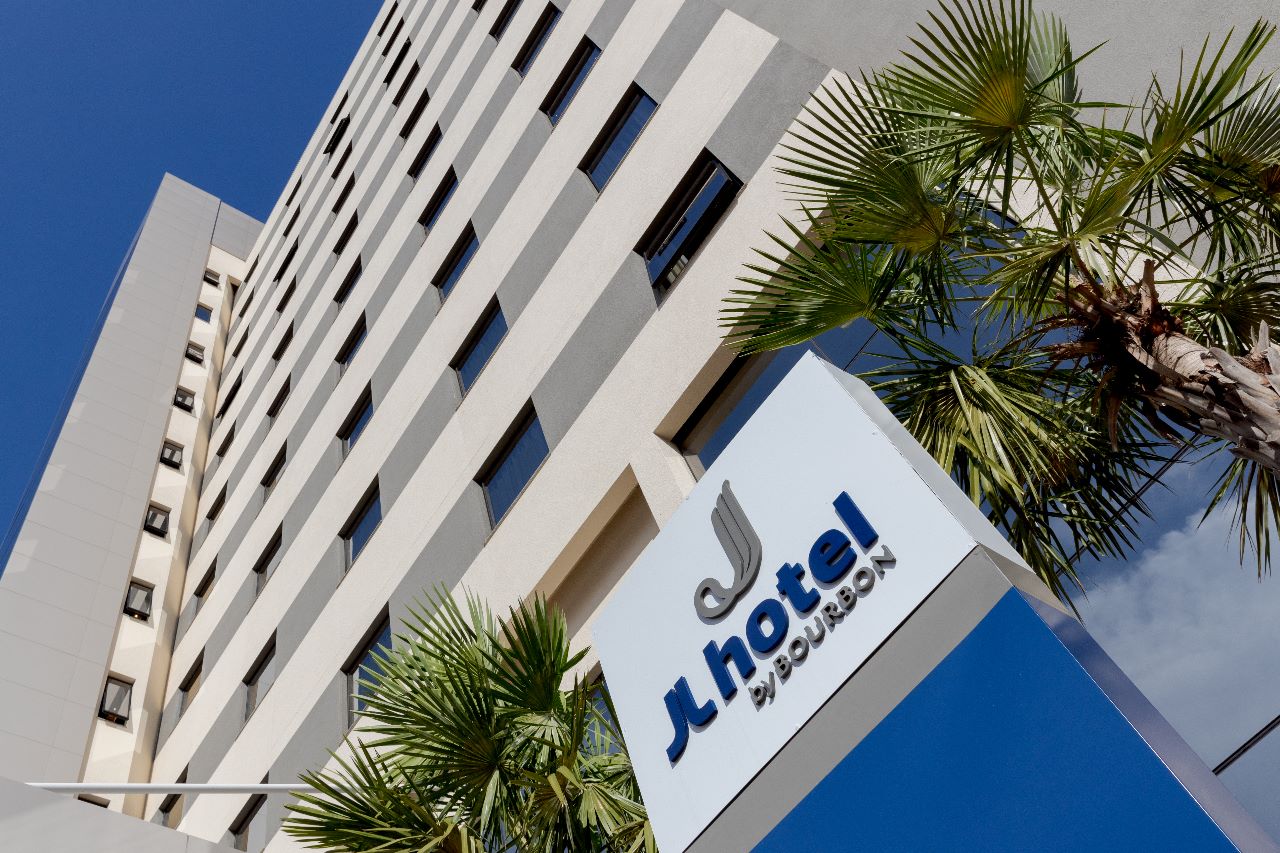
O HOTEL
Próximo a tudo que vocę mais gosta em Foz do Iguaçu
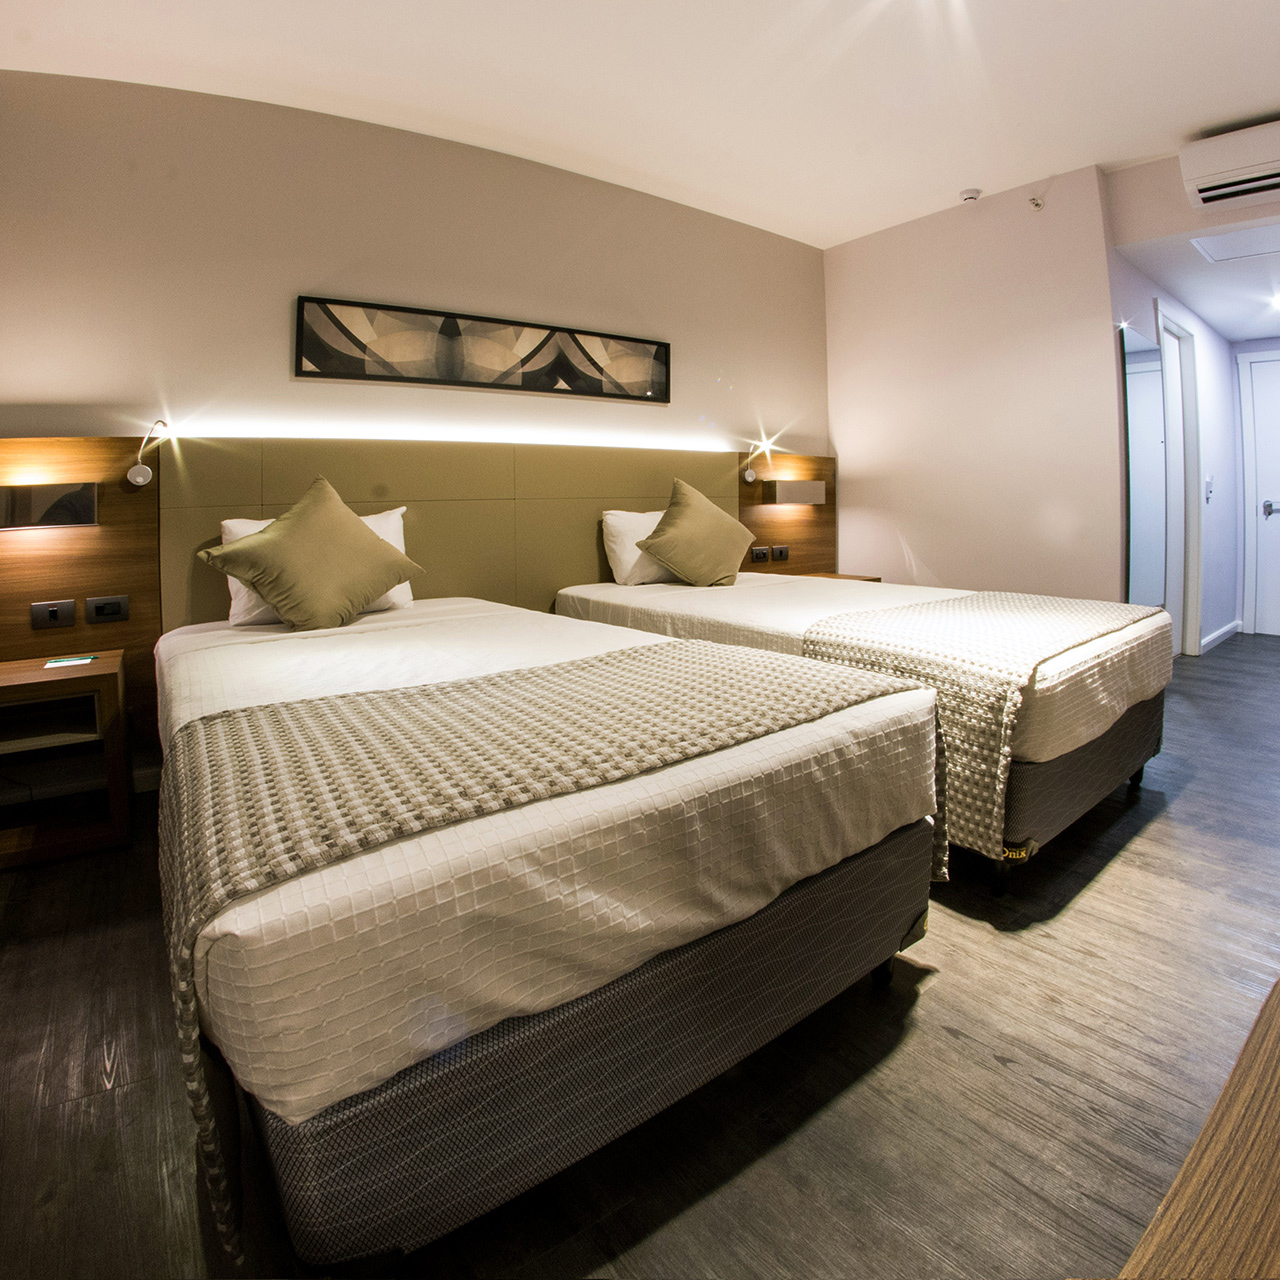
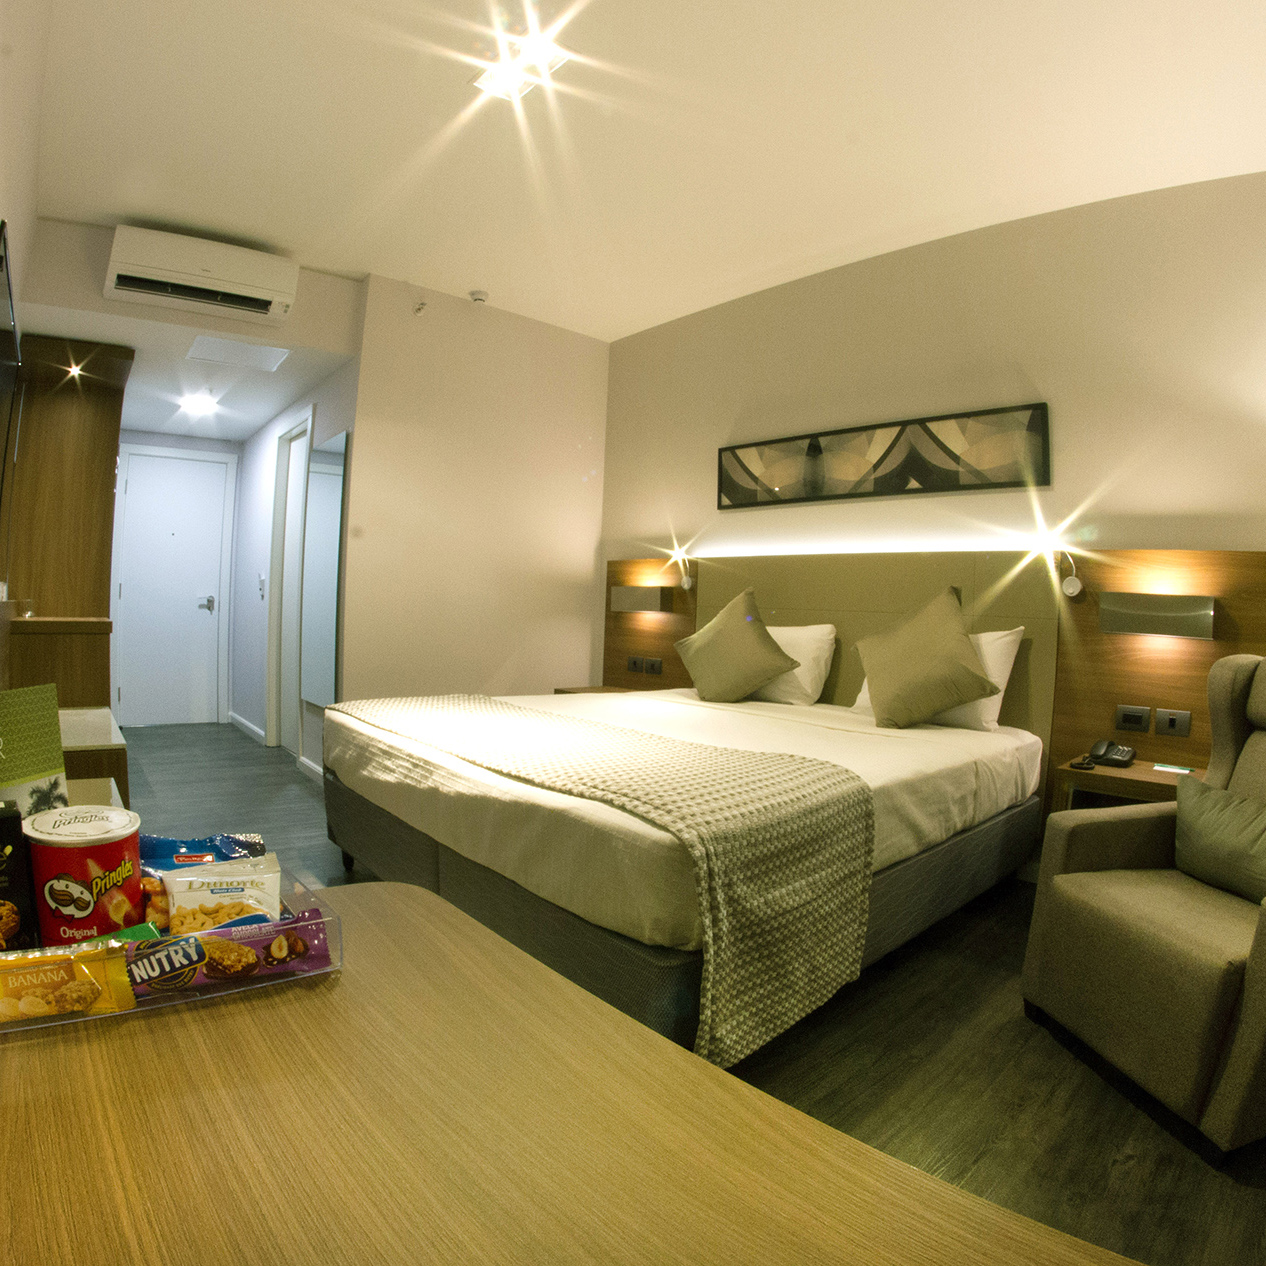
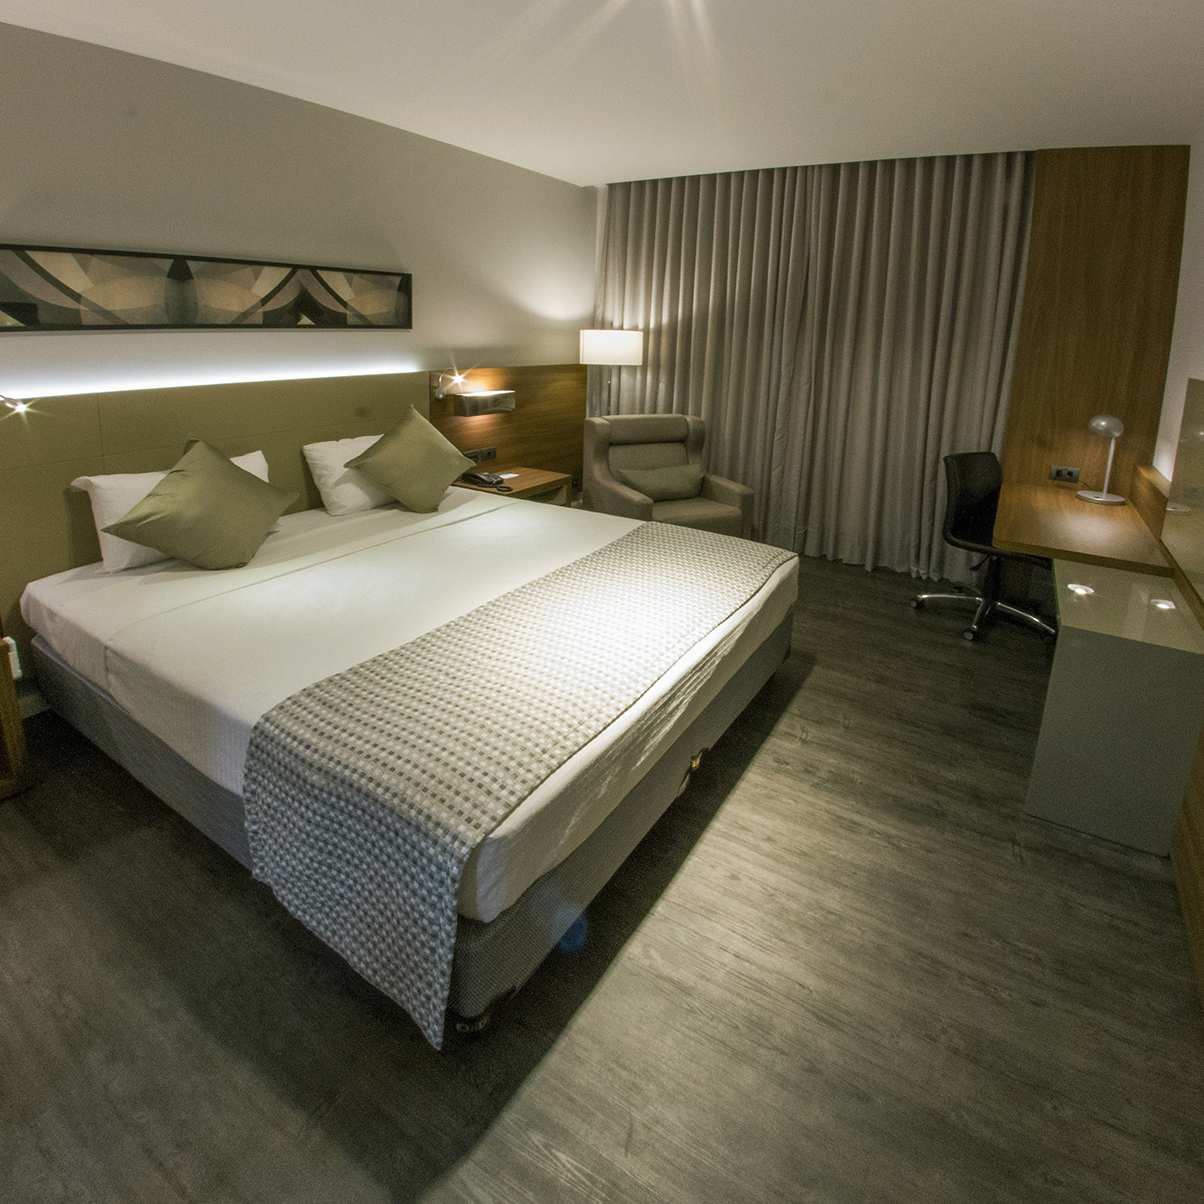
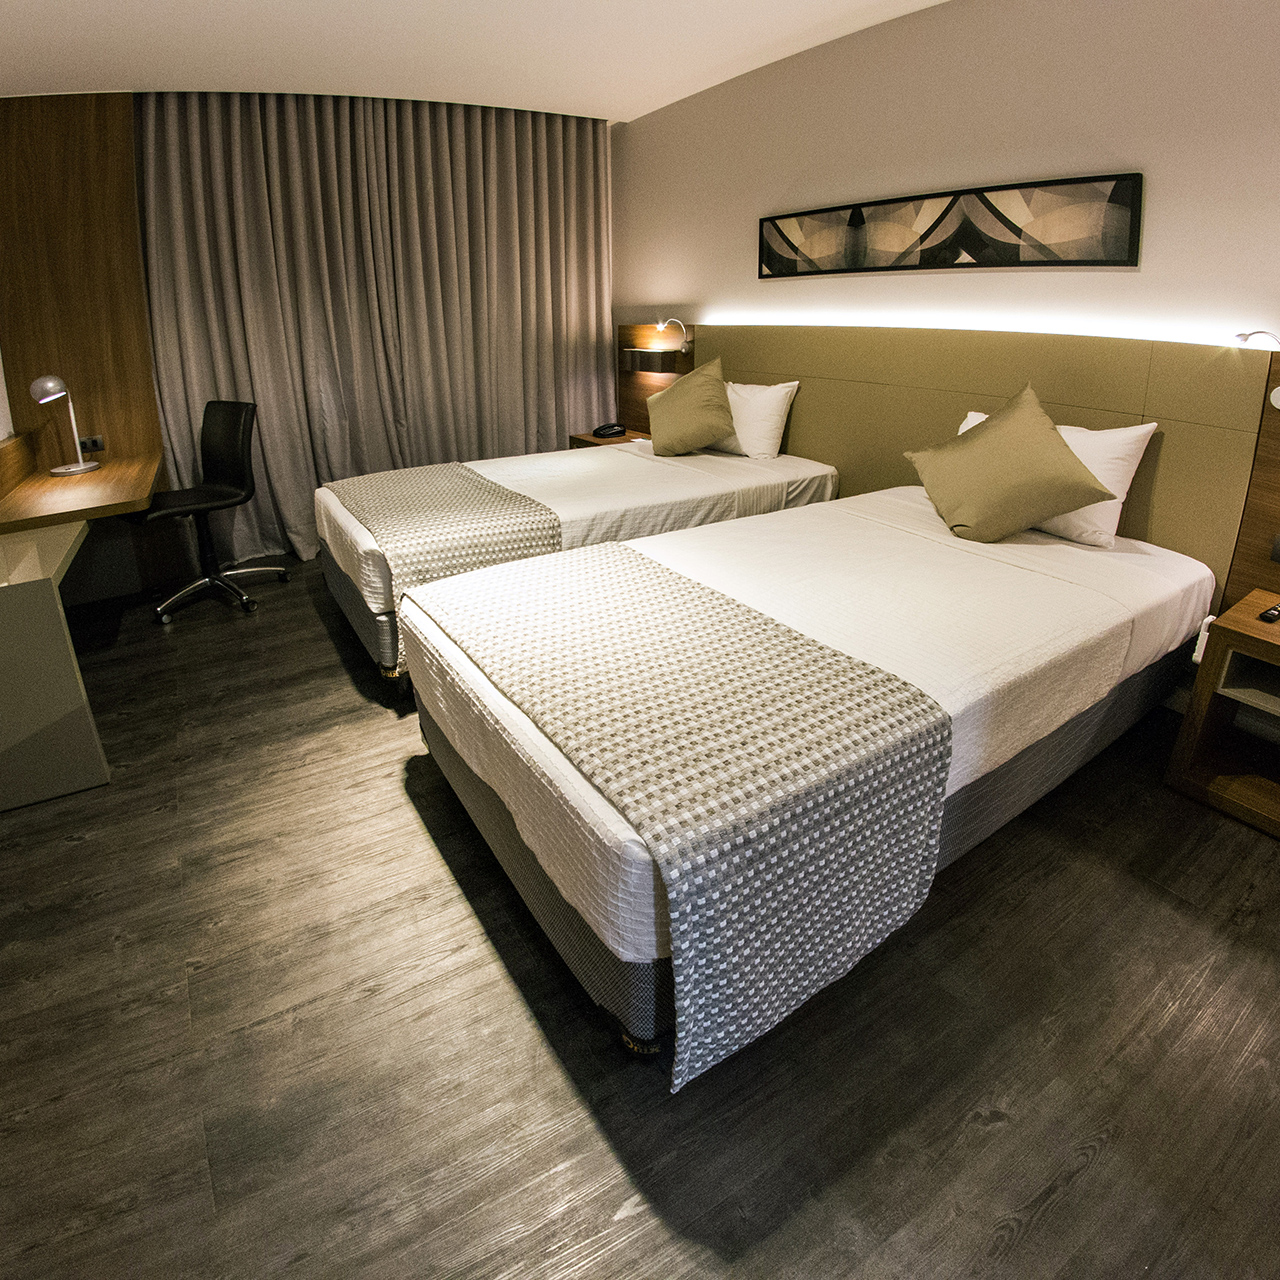
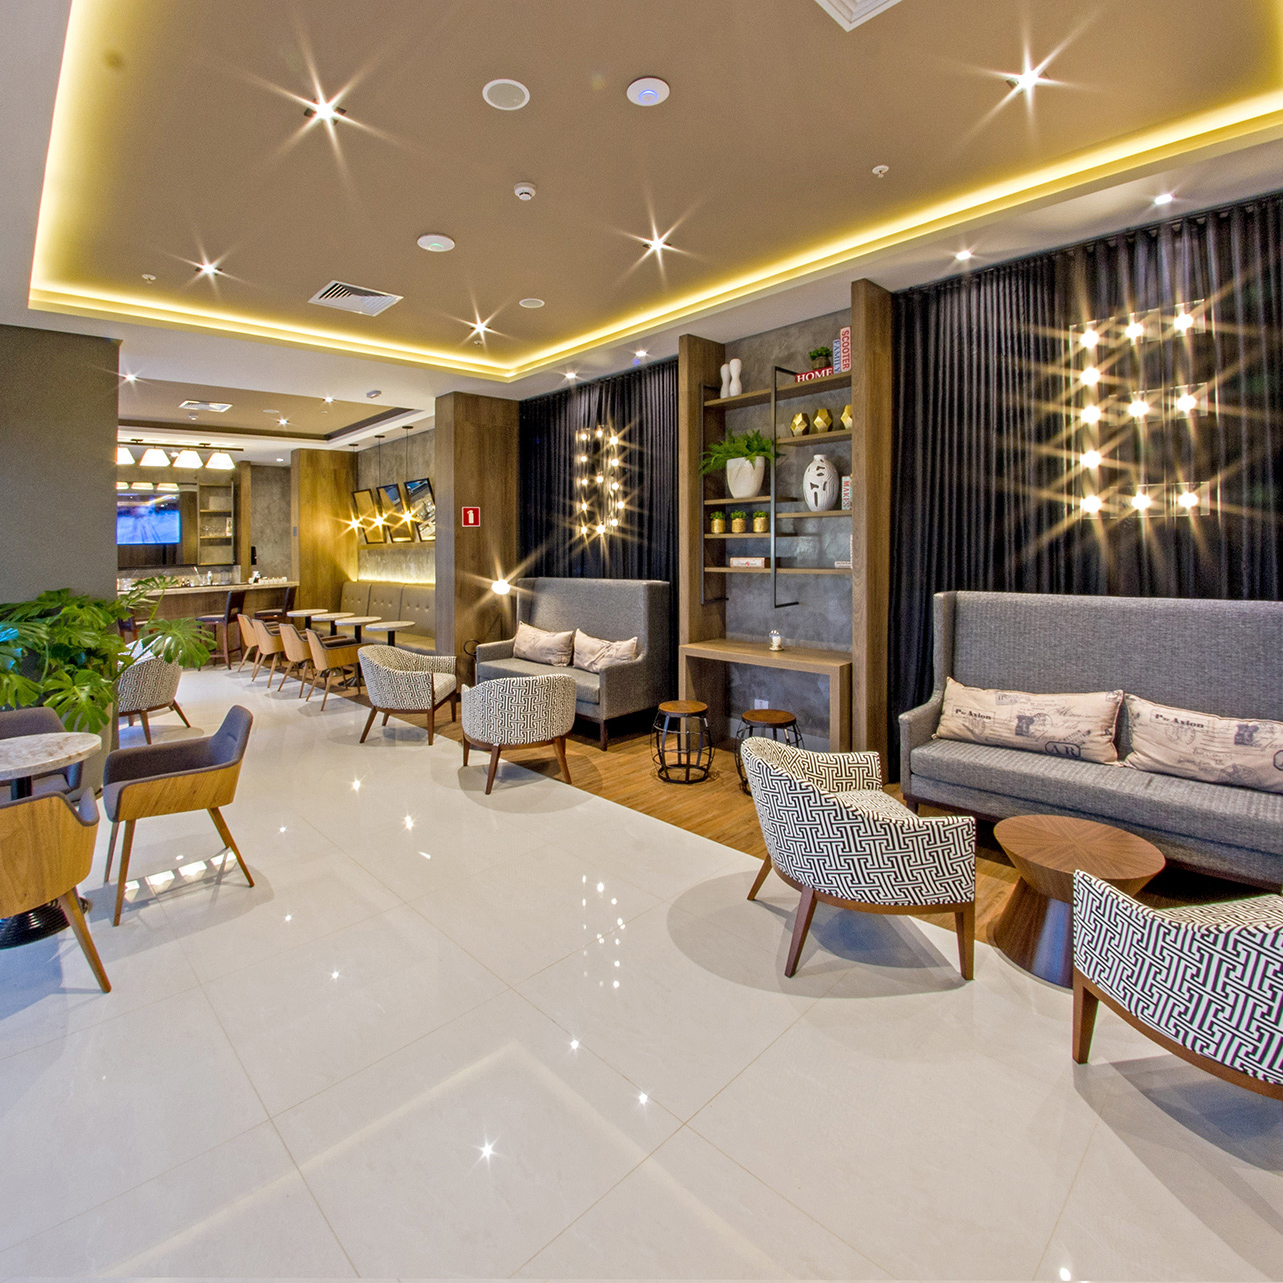
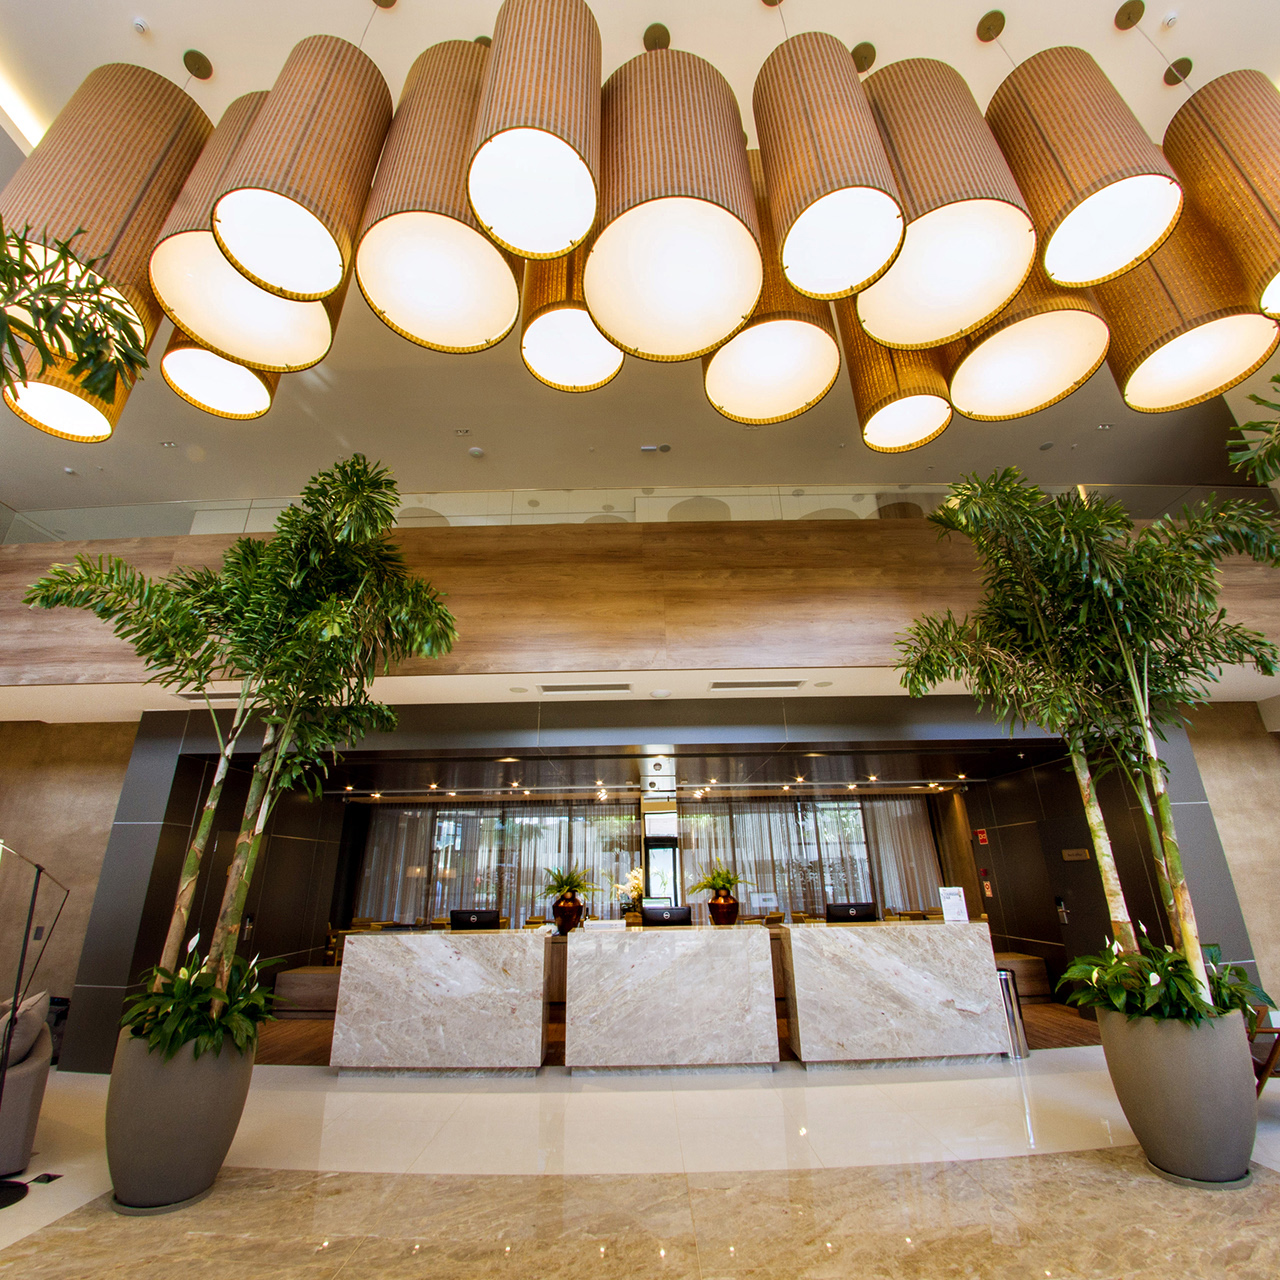
O JL Hotel by Bourbon disponibiliza de modernos e confortáveis apartamentos, próximo a tudo que você mais gosta em Foz do Iguaçu. Estamos a 10 minutos do Parque das Aves e das Cataratas do Iguaçu, do aeroporto Internacional e em frente ao Cataratas JL Shopping.
Endereço: Avenida Costa e Silva, 154, Foz do Iguaçu, Paraná - Brasil
Telefone:+55 (45) 3422-1000
Email: reservas1@jlhotelbybourbon.com.br


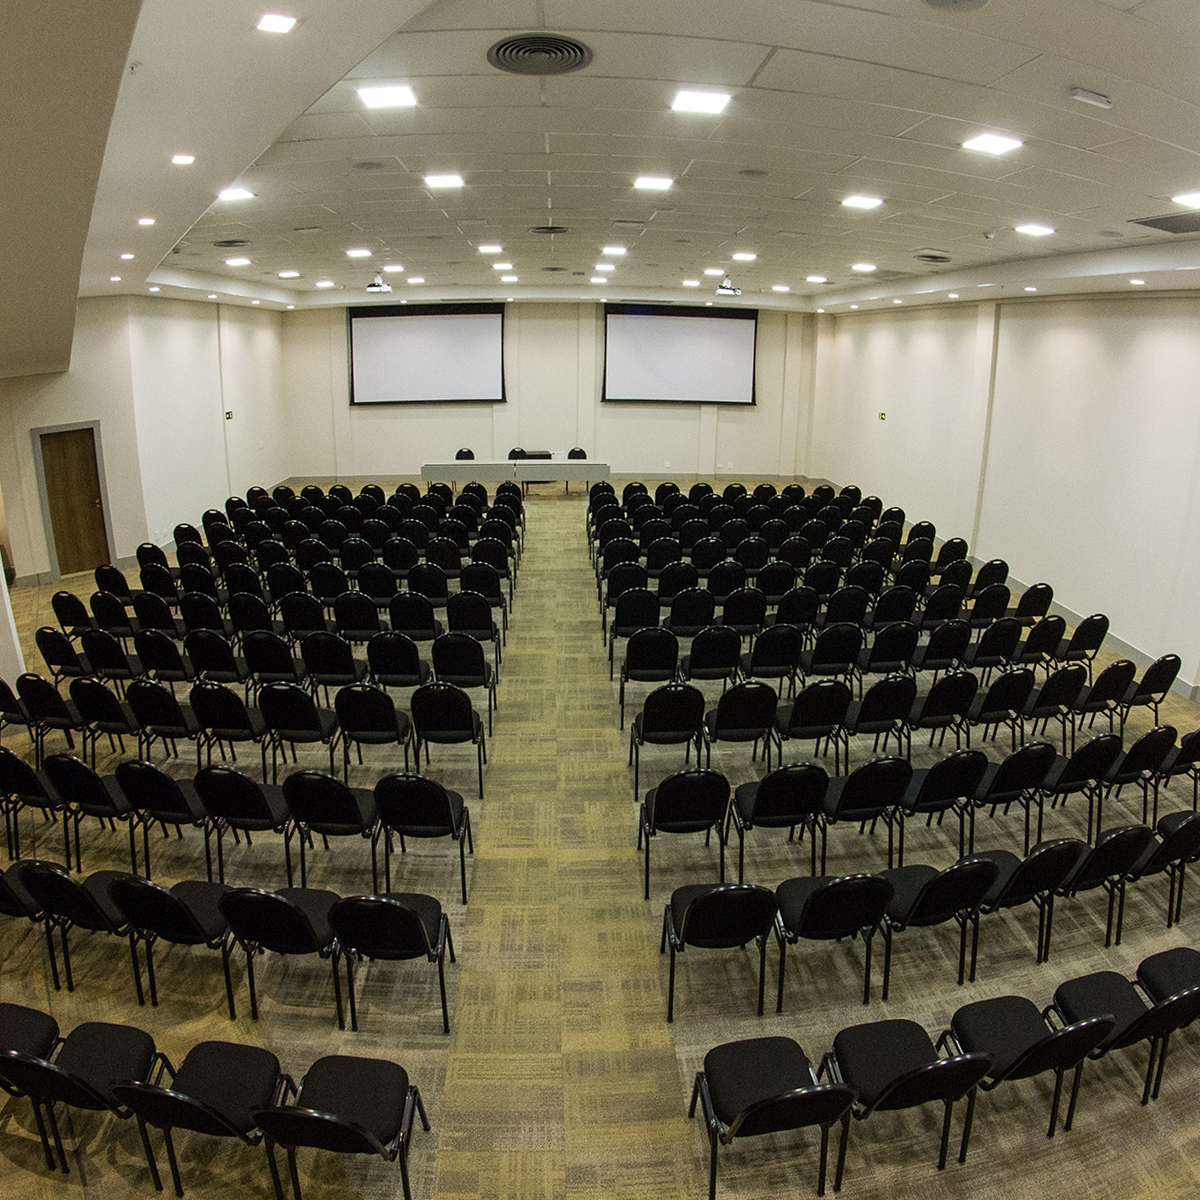
COMODIDADES

Academia

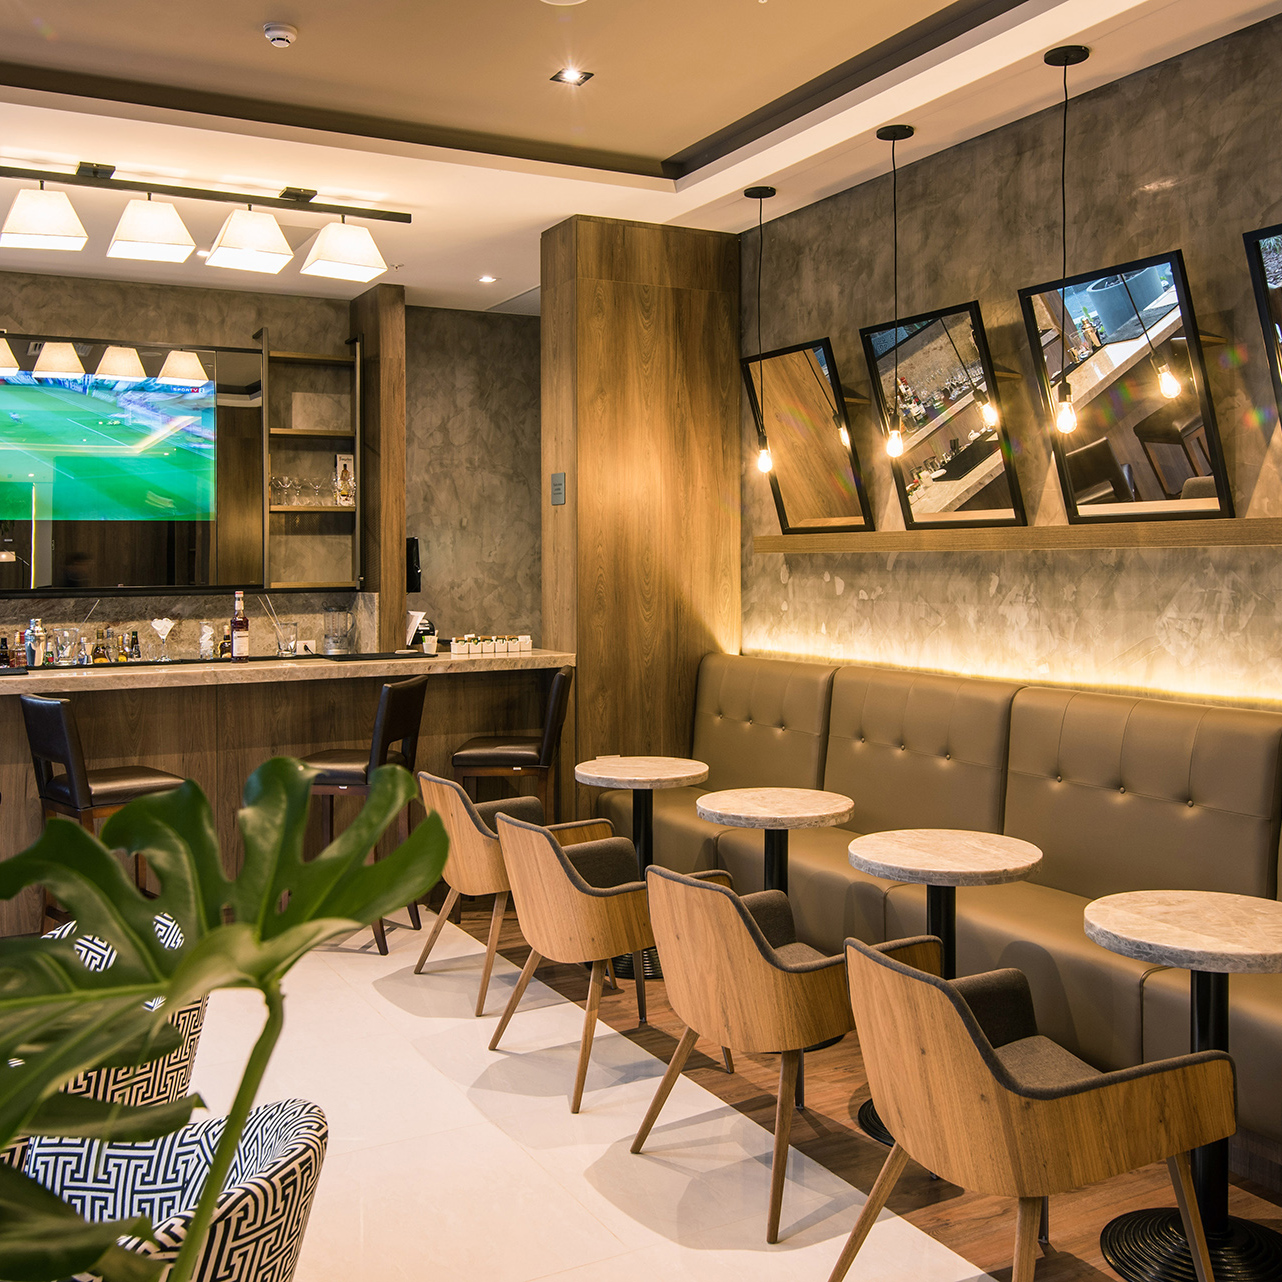
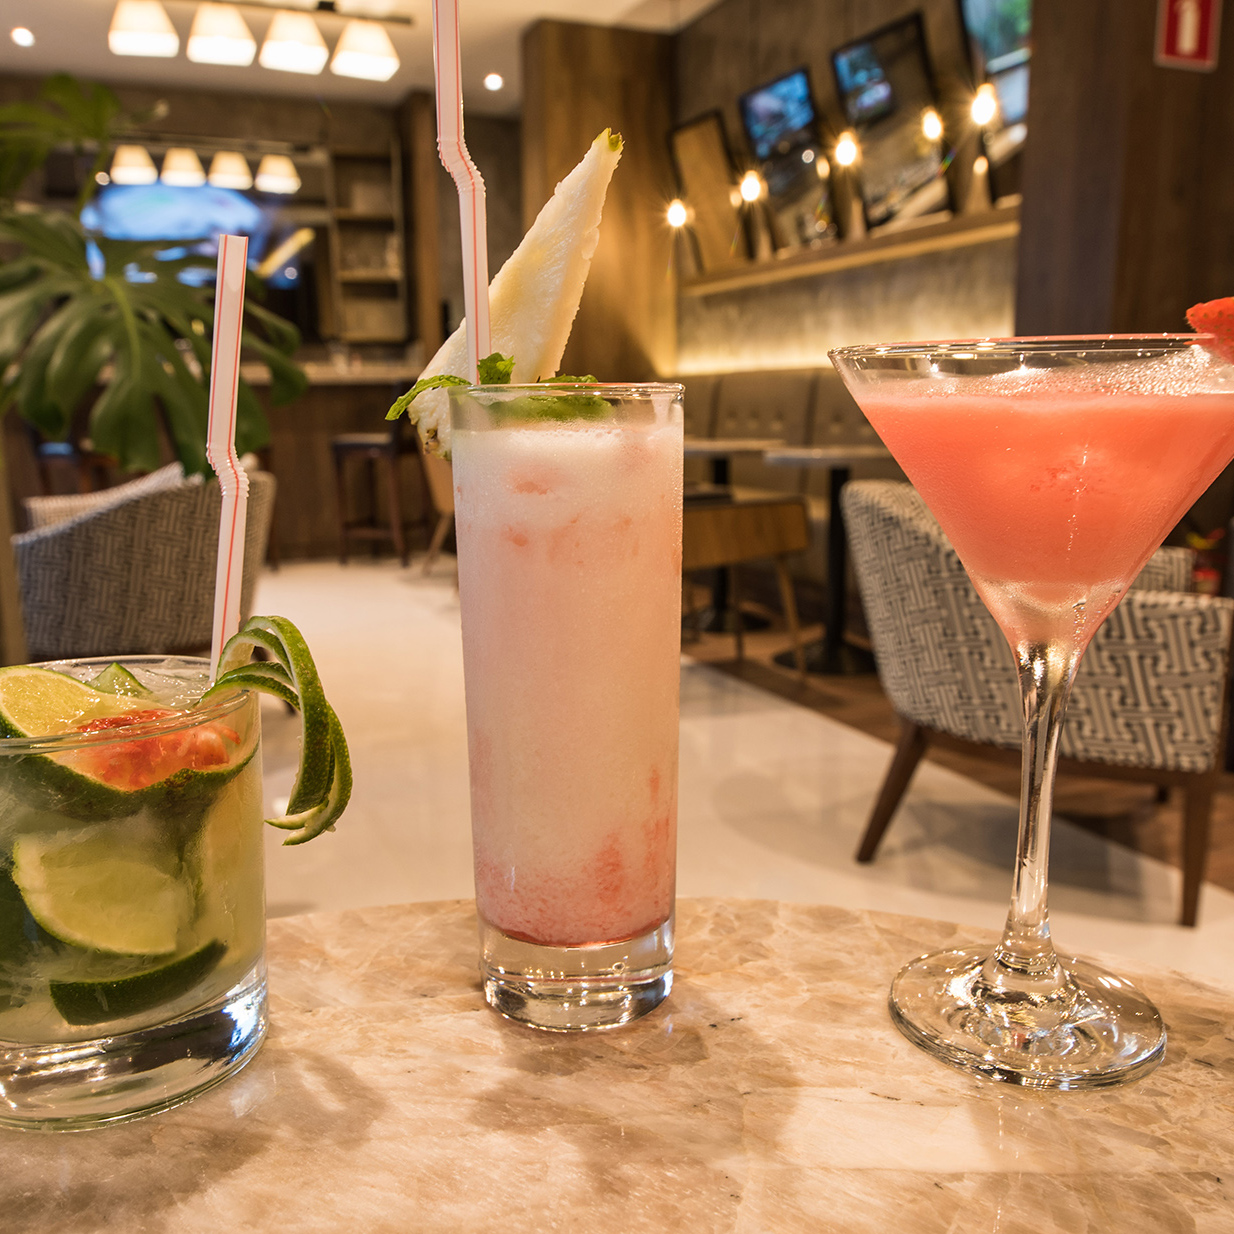
bar

café da Manhă

Canais TV

cardápio

Estacionamento

Frigobar

Lavanderia

Pesquisa de Satisfaçăo

Pet Friendly

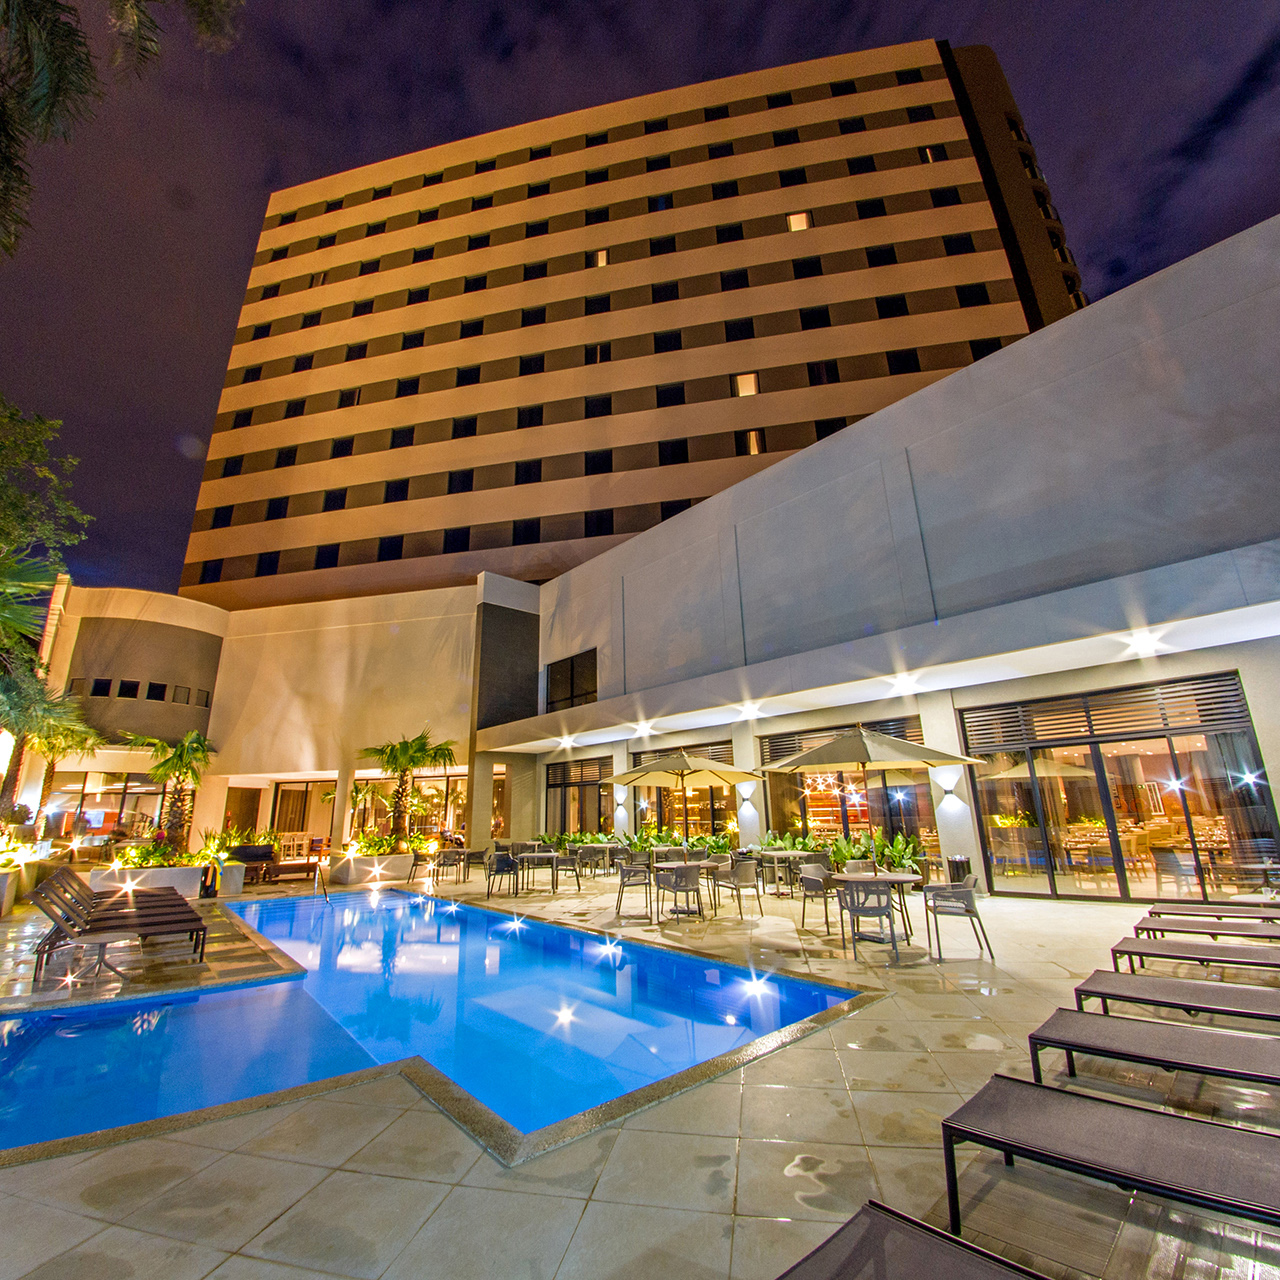
Piscina

Ramais

sala Conferęncia